Organic search revenue up 245.76%
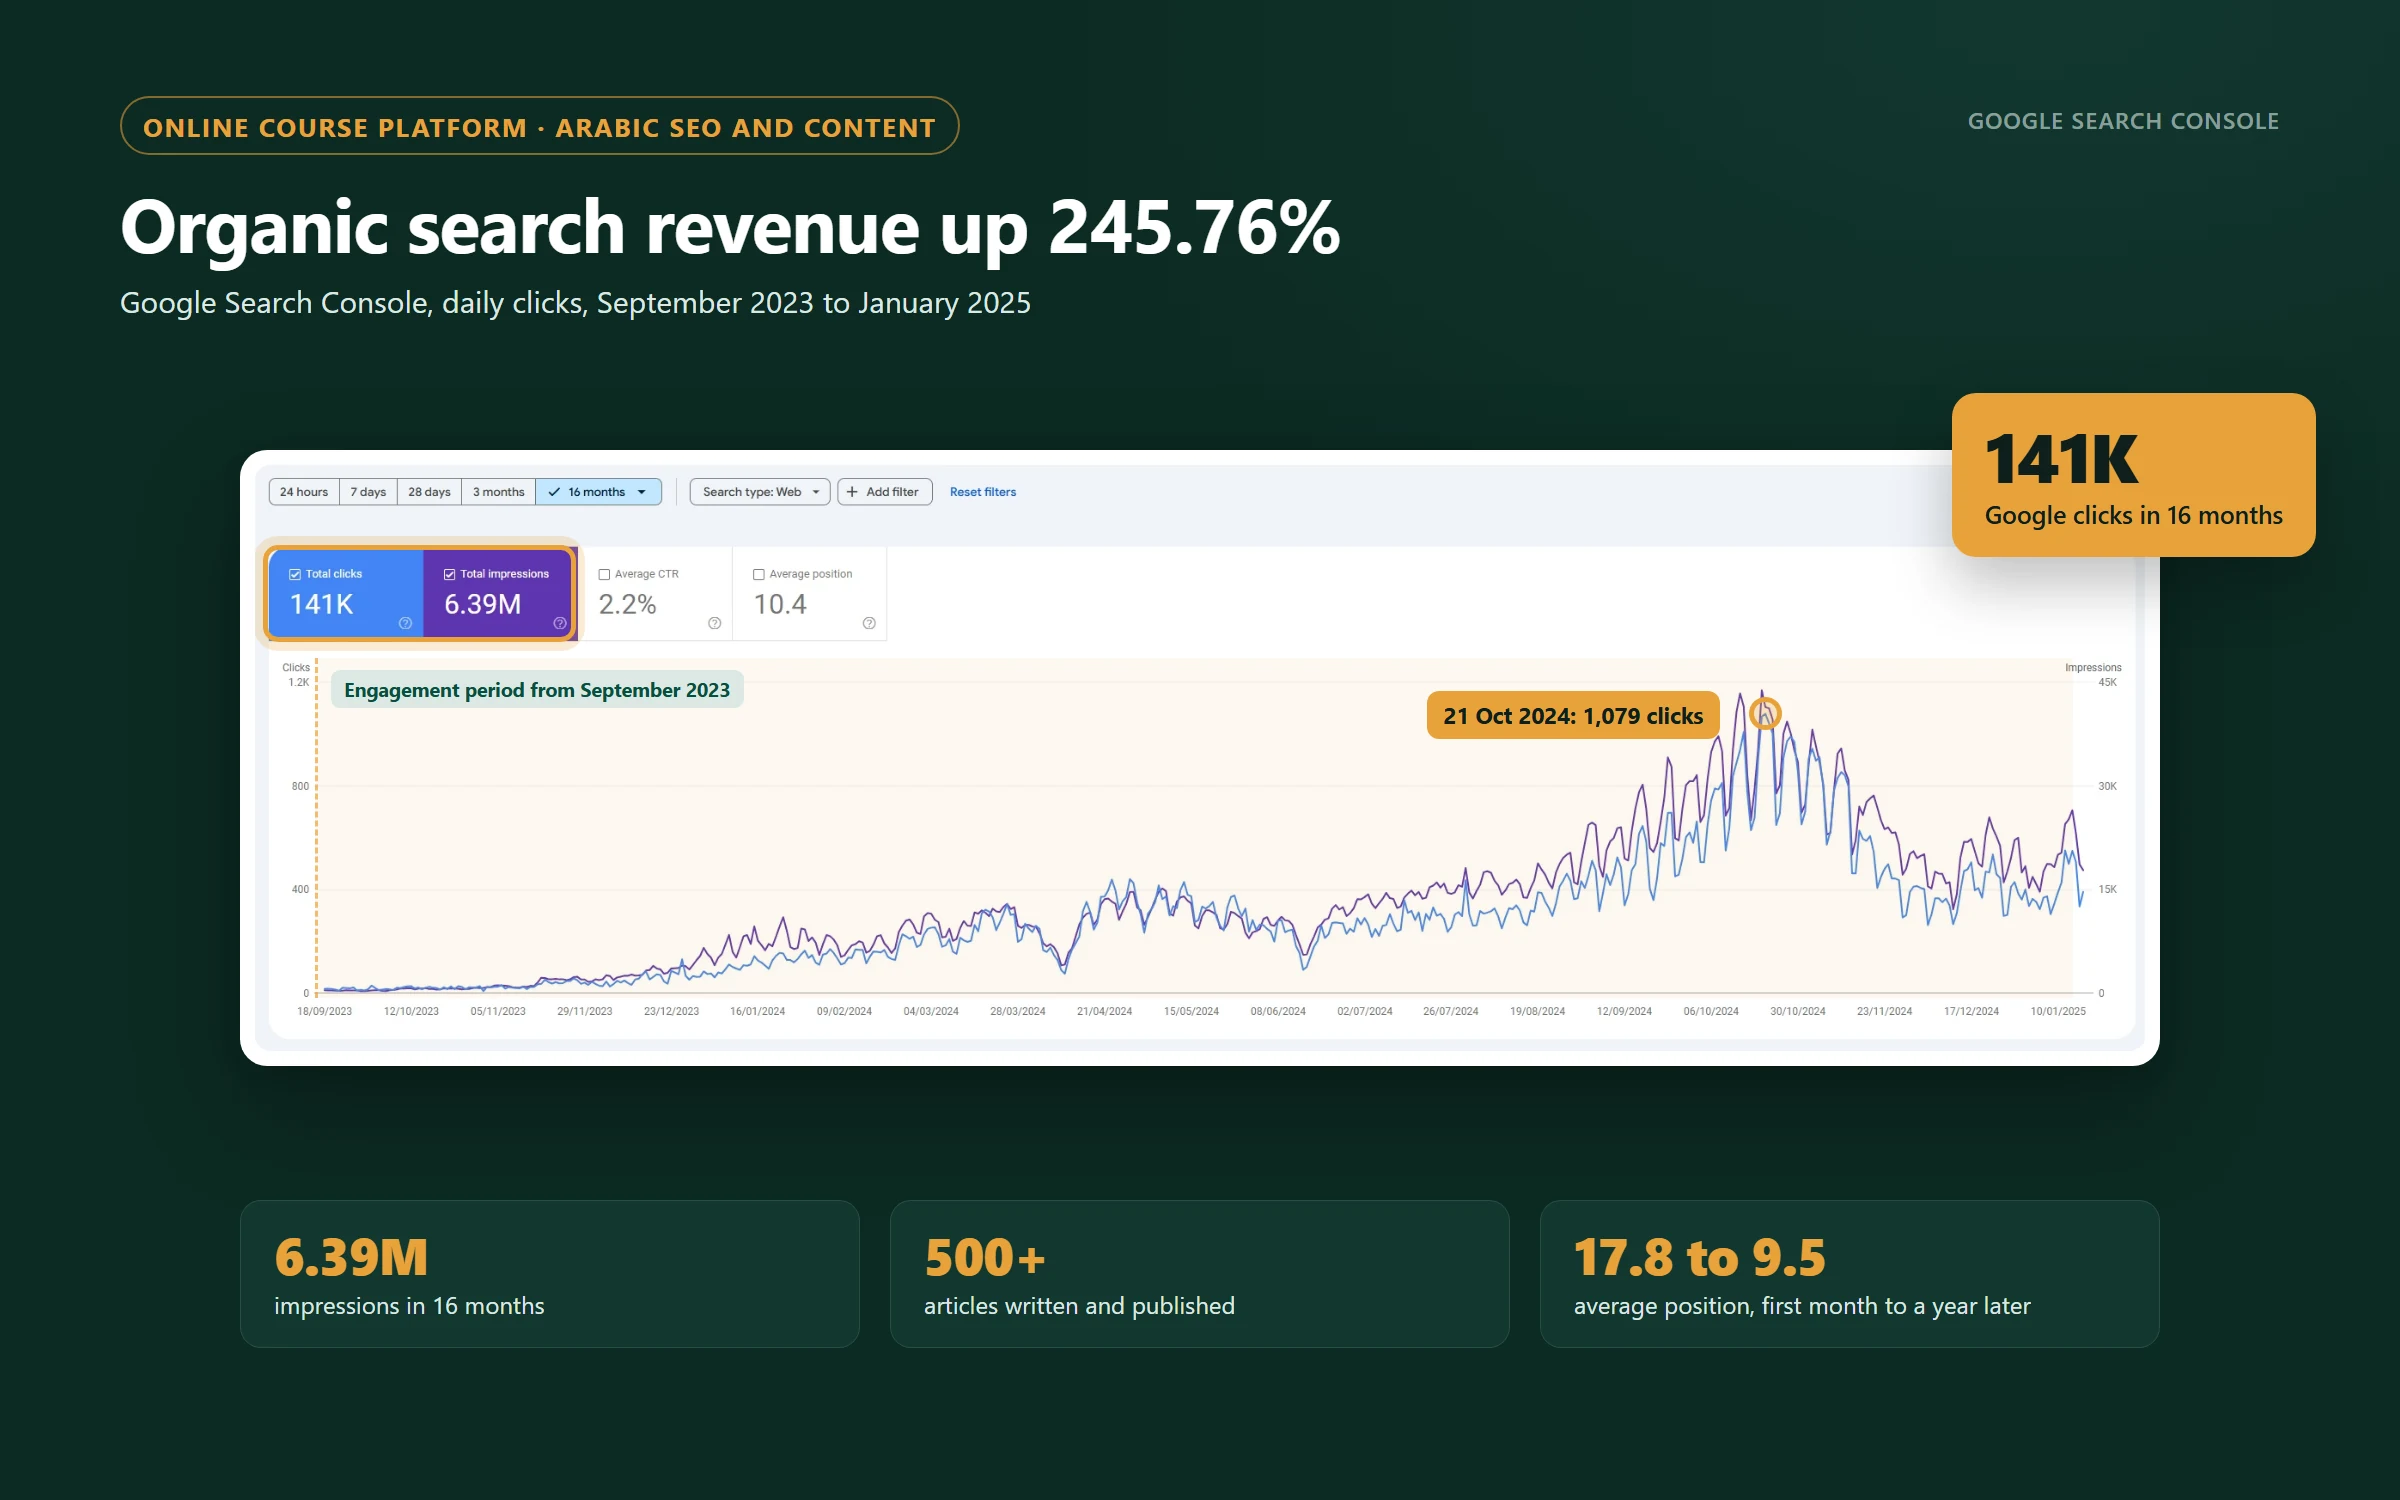
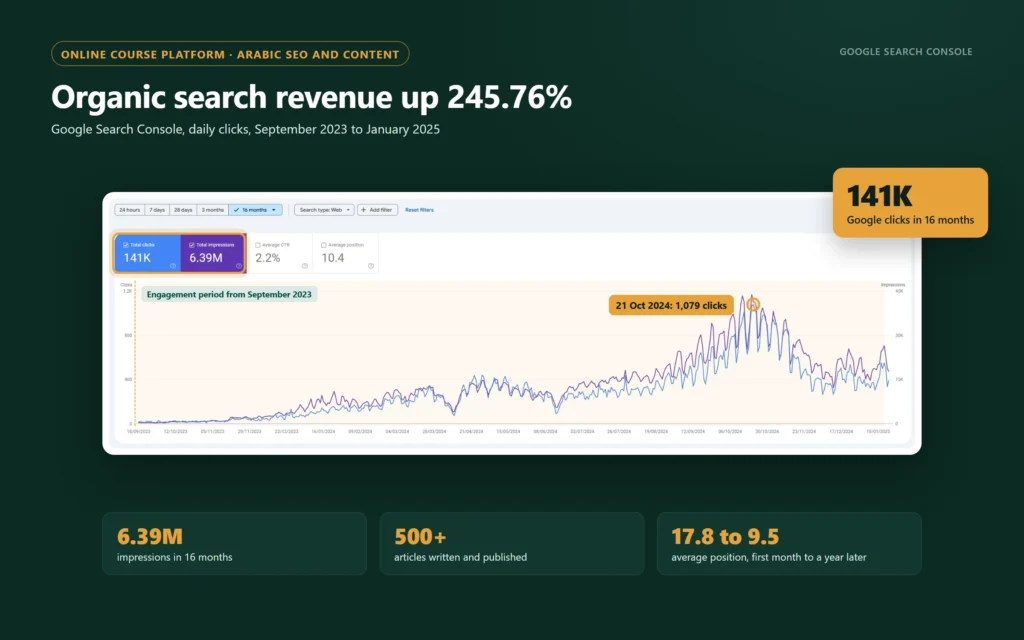
614 clicks in the first month of the engagement. About 30,000 in five weeks a year later. Organic search revenue up 245.76% year on year, while the rest of the site shrank.
- Published
- 7 min read
Project at a glance
- Industry
- EdTech, online courses
- Region
- Middle East and North Africa
- Largest search markets
- Saudi Arabia and Egypt
- Engagement
- September 2023 to February 2025
- Team
- 4 to 6 specialists across SEO strategy, content and technical SEO
- Scope
- Keyword research, content strategy, blog build and 500+ articles, technical SEO, course pages
- Contract
- Monthly retainer
- Stack
- WordPress, Search Console, GA4, Semrush, Ahrefs, Screaming Frog, PageSpeed Insights
- Headline result
- Organic search revenue +245.76%; organic sessions +141% while total sessions fell 30.9%
Case study contents
| 614 to ~30,000 | Google clicks, first month against five weeks a year later |
| +245.76% | organic search revenue, 2024 against 2023 (GA4) |
| 141K | Google clicks across 16 months, from 6.39M impressions |
| 17.8 to 9.5 | average position, first month to a year later |
At a glance
An Arabic online course platform had almost no search presence and no blog. Over the engagement, more than 500 articles, technical fixes and course page optimisation took it from 614 Google clicks in the first month to about 30,000 in five weeks, and organic search revenue rose 245.76% year on year.
The client
The platform sells Arabic courses taught by many instructors, in subjects such as creative writing, perfume and soap making, early childhood development, communication skills and management. Saudi Arabia and Egypt are its two largest search markets.
The starting point
When the engagement began in September 2023, organic search was a minor channel:
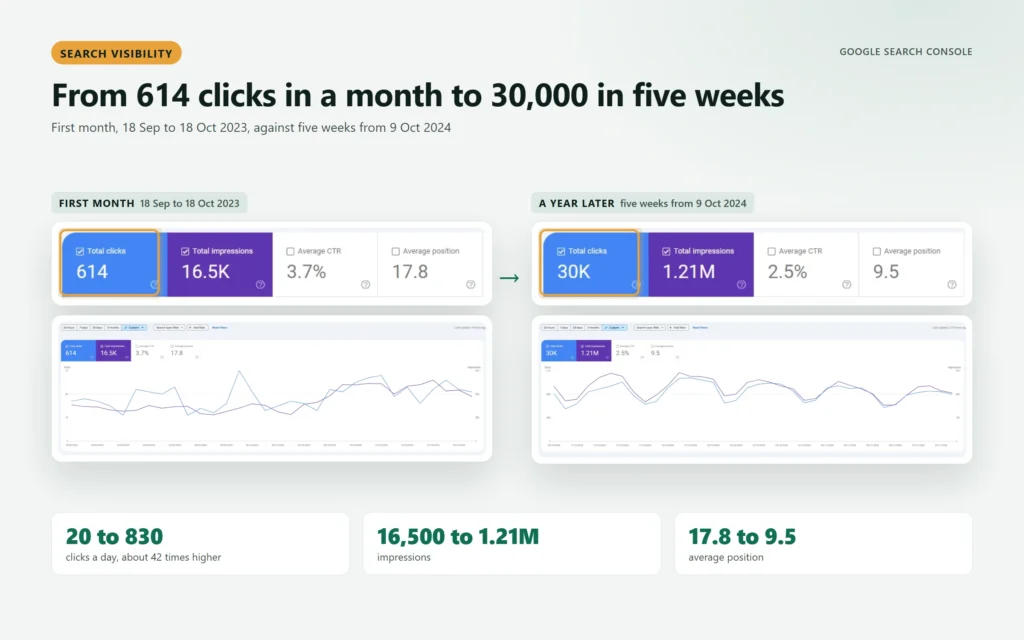
- 614 clicks and 16,500 impressions in the first month, 18 September to 18 October 2023, about 20 clicks a day
- An average position of 17.8, on the second page of results
- No blog. The earliest blog URL in search data is dated 5 September 2023
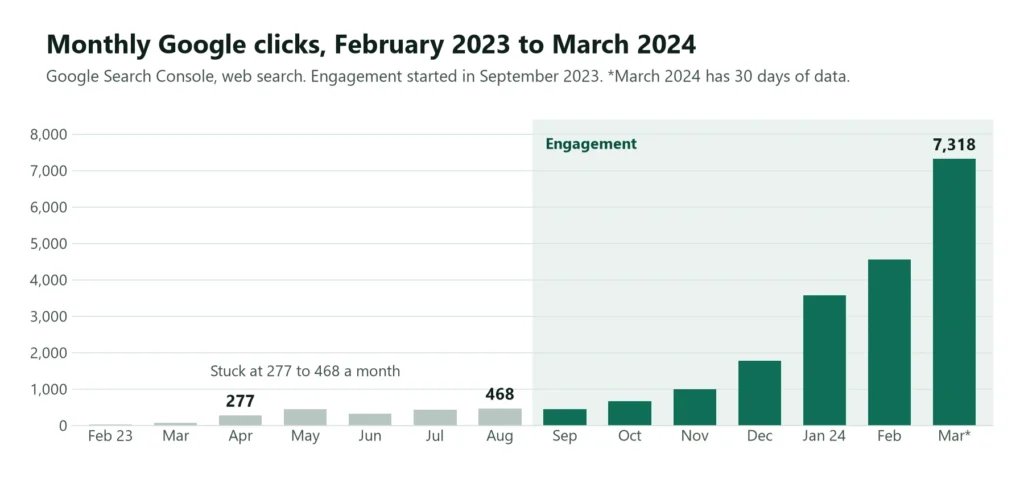
- A flat trend. Monthly organic clicks had stayed between 277 and 468 from April to September 2023
The challenge
Organic search had stalled. For six months before the engagement, organic clicks held at a few hundred a month.
Nothing answered the questions learners search for. The site had course pages and no blog. When a learner searched for a topic the platform teaches, there was no page that answered the question.
No plan linking topics to courses. Without a keyword map, there was no way to decide which subjects to write about first, or which course each article should send readers to.
New content needed a site Google could crawl. Indexing and the sitemap needed fixing, and the site needed to be faster, before a large volume of new pages could be found.
Course pages not built for search. Their titles, meta descriptions and on-page content were not written to rank, and no internal links pointed readers from content to courses.
Why the platform chose us
- A proven track record: a portfolio of SEO work with measurable results
- Knowledge of the Gulf market: experience with Arabic-speaking audiences in Saudi Arabia and across the Gulf
- Fast response: quick turnaround on requests and changes
- Business understanding: a focus on what the business needed from search, beyond rankings
What we did, challenge by challenge
Strategy, content production, technical SEO and on-page optimisation were all handled by one team of 4 to 6 specialists.
| Challenge | What we did |
|---|---|
| Organic search had stalled | Built a content-led growth plan around topic demand rather than brand demand |
| Nothing answered learners’ questions | Built the blog and wrote more than 500 articles |
| No plan linking topics to courses | Researched keywords and mapped each topic cluster to a related course |
| Crawlability | Fixed indexing and the sitemap, and improved site speed |
| Course pages not built for search | Rewrote titles, meta and content, and added internal links from articles to courses |
Timeline
| When | What happened |
|---|---|
| September 2023 | Engagement starts; first blog articles go live |
| September 2023 to January 2024 | Publishing ramps up, peaking in November 2023 with 183 blog URLs dated that month |
| 2024 | Production continues. Several of the biggest gainers in the second half of 2024 were articles published in April, May and August 2024 |
| October 2024 | Organic search peaks at 1,079 clicks on a single day, 21 October |
| Throughout | Technical SEO and course page optimisation ran alongside content production |
| February 2025 | Engagement ends |
The results
Search visibility
Clicks
about 30,000
- First month
- 614
- Five weeks from 9 Oct 2024
- about 30,000
Impressions
1.21 million
- First month
- 16,500
- Five weeks from 9 Oct 2024
- 1.21 million
Average position
9.5
- First month
- 17.8
- Five weeks from 9 Oct 2024
- 9.5
Measured per day, clicks rose from about 20 to about 830, roughly 42 times higher.
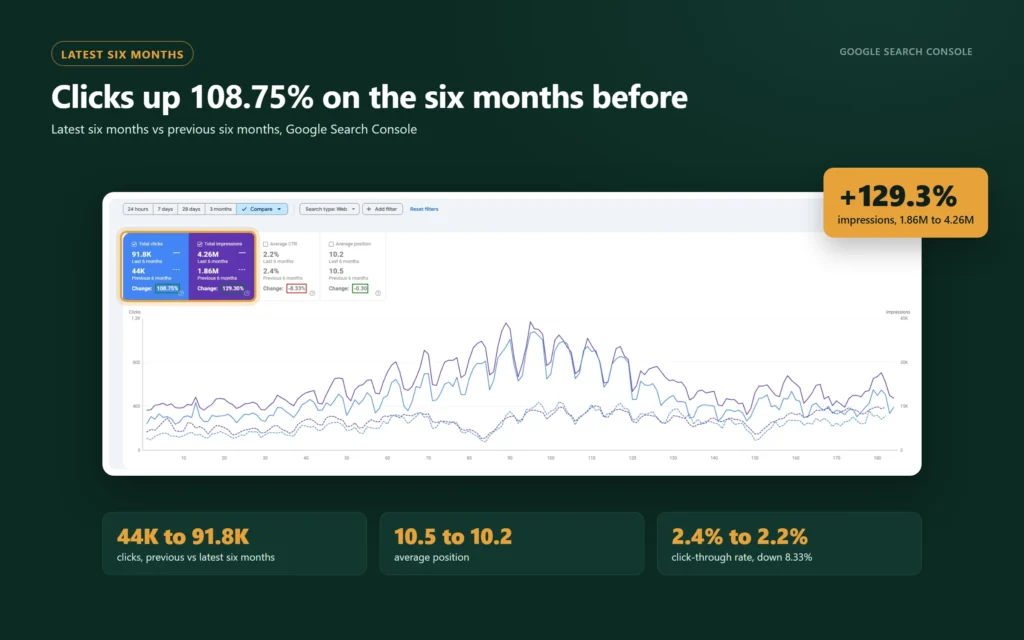
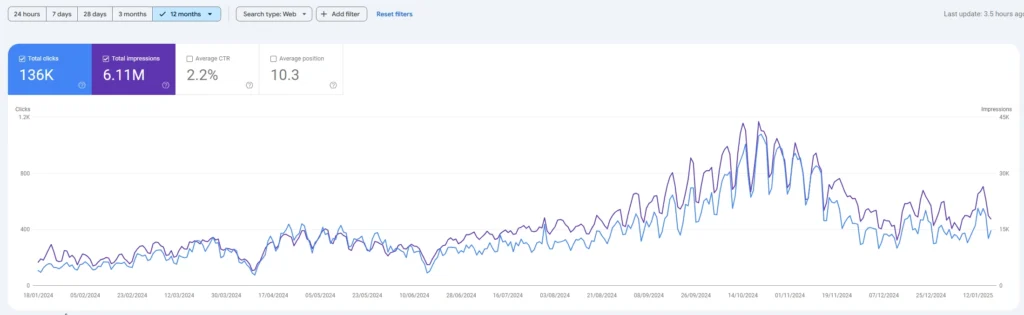
Across 16 months the site earned 141,000 clicks from 6.39 million impressions, and 136,000 clicks in the most recent 12 months alone. Comparing the latest six months with the six before them, clicks rose 108.75% (44,000 to 91,800) and impressions rose 129.3% (1.86 million to 4.26 million).
Revenue from organic search
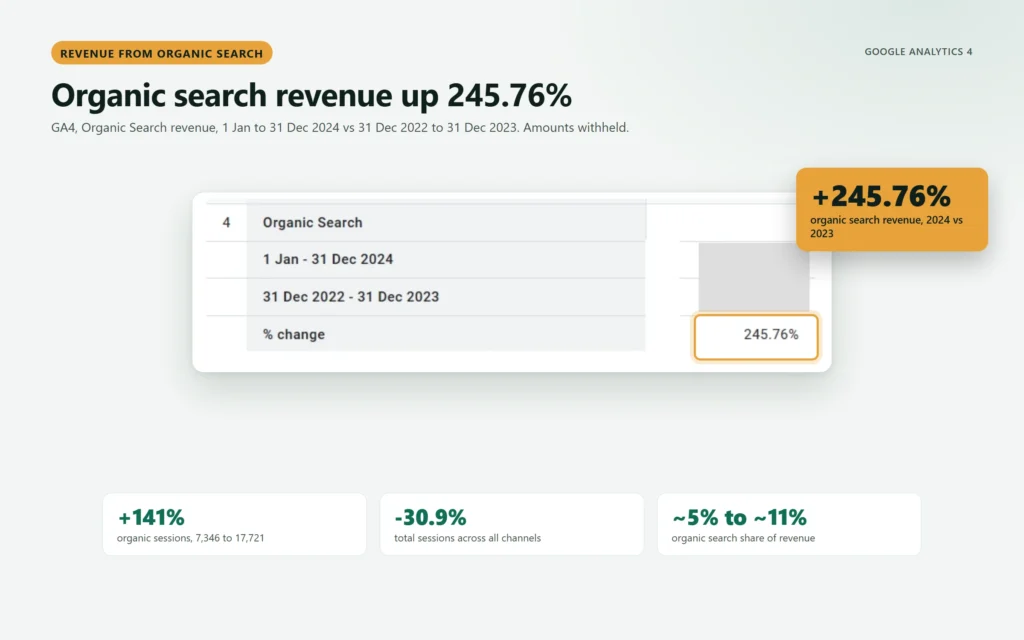
Revenue attributed to organic search in GA4 rose 245.76% in 2024 against 2023. Organic search also became a bigger part of the business: its share of total revenue rose from about 5% in 2023 to about 11% in 2024, calculated from GA4’s rounded totals.
Organic grew while the rest of the site shrank
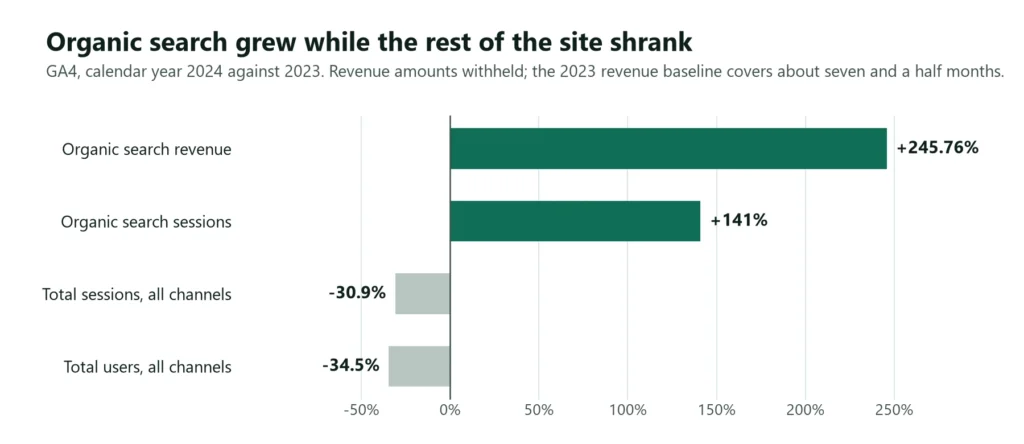
In 2024 the platform’s total sessions fell 30.9% and total users fell 34.5% across all channels. Over the same year, organic search sessions rose 141%, from 7,346 to 17,721.
Where the growth came from
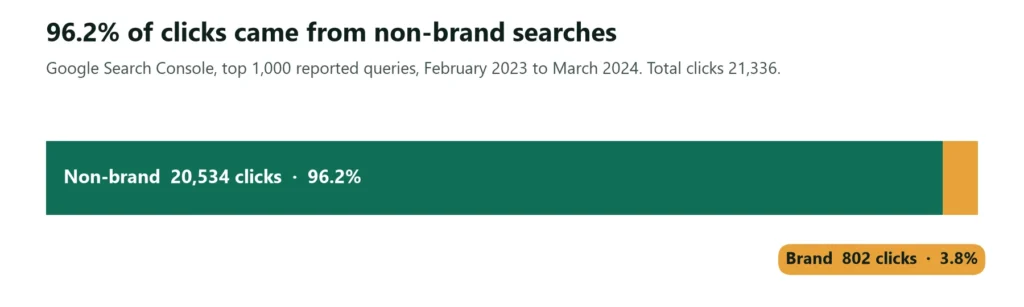
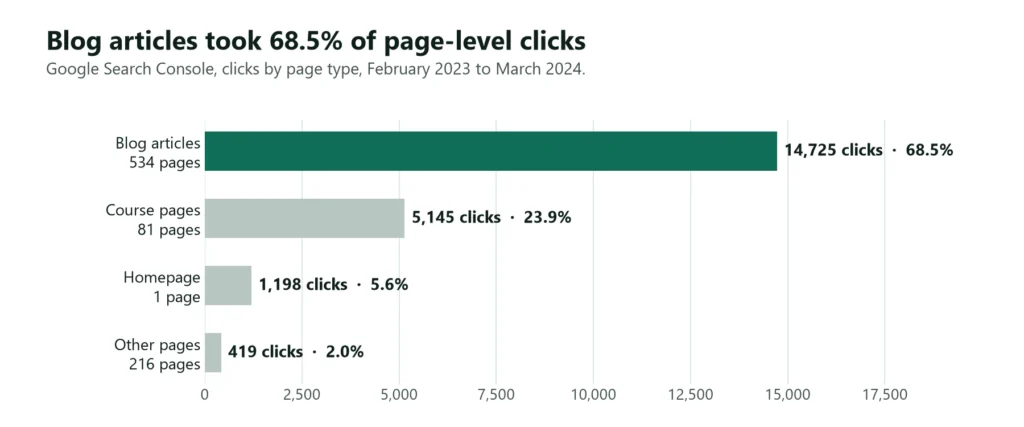
Between February 2023 and March 2024, more than 96% of organic clicks came from non-brand searches, and 68.5% of page-level clicks landed on blog articles. All ten pages that gained the most clicks in the latest six months were blog posts. The top gainer, a guide to making soap at home, went from 19 clicks to 3,475 in six months.
The cost of standing still
For the six months before the engagement, organic clicks held at a few hundred a month. Had nothing changed, organic search would have stayed a minor channel. In 2024, while traffic from the platform’s other channels fell, organic search was the channel that grew.
What the platform can do now
- An owned acquisition channel. Organic search brought 141,000 clicks over 16 months, mostly from people who had never searched for the brand.
- A larger share of revenue from search. Organic search’s share of revenue roughly doubled in a year.
- A content library that keeps working. More than 500 articles, linked to the courses they support.
What the data does not show
- The 2023 revenue baseline is partial. GA4 began recording revenue around May 2023, so the 245.76% compares a full 2024 with about seven and a half months of 2023.
- Conversions fell while revenue rose. Organic key events fell 68%, from 3,509 to 1,111, and the key event rate fell from 12.29% to 2.81%. The data does not show why the two moved in opposite directions.
- GA4 records far fewer visits than Search Console. GA4 logged 17,721 organic sessions in 2024, against 136,000 Google clicks between mid-January 2024 and mid-January 2025. Read GA4 figures here as trends, not totals.
- Reporting windows differ. Search Console figures carry their own date ranges, from September 2023 to January 2025. GA4 figures compare calendar years 2024 and 2023.
The growth followed the content and technical work closely in time, and it was concentrated in the new articles. The data supports a link; on its own it does not prove cause.
The numbers worth reading closely
- After the peak. Daily clicks eased from about 1,000 at the October 2024 peak to roughly 400 to 550 in December 2024 and January 2025, still 20 or more times the first month’s daily average.
- Click-through rate fell. CTR in the latest six months was 2.2%, against 2.4% in the previous six. Impressions grew faster than clicks.
- The starting base was small. About 20 clicks a day is a low base, so multiples are large. The absolute numbers sit beside every ratio for that reason.
- Some traffic was off-topic. A broad guide to Instagram was one of the largest articles, a long way from the courses the platform sells.
What this means for course platforms
- Your topics are your biggest audience. Few people search for a course platform by name. The people searching for what it teaches are the larger market.
- Volume needs a foundation. Indexing, sitemap and speed fixes made it possible for hundreds of new pages to be crawled and found.
Related articles
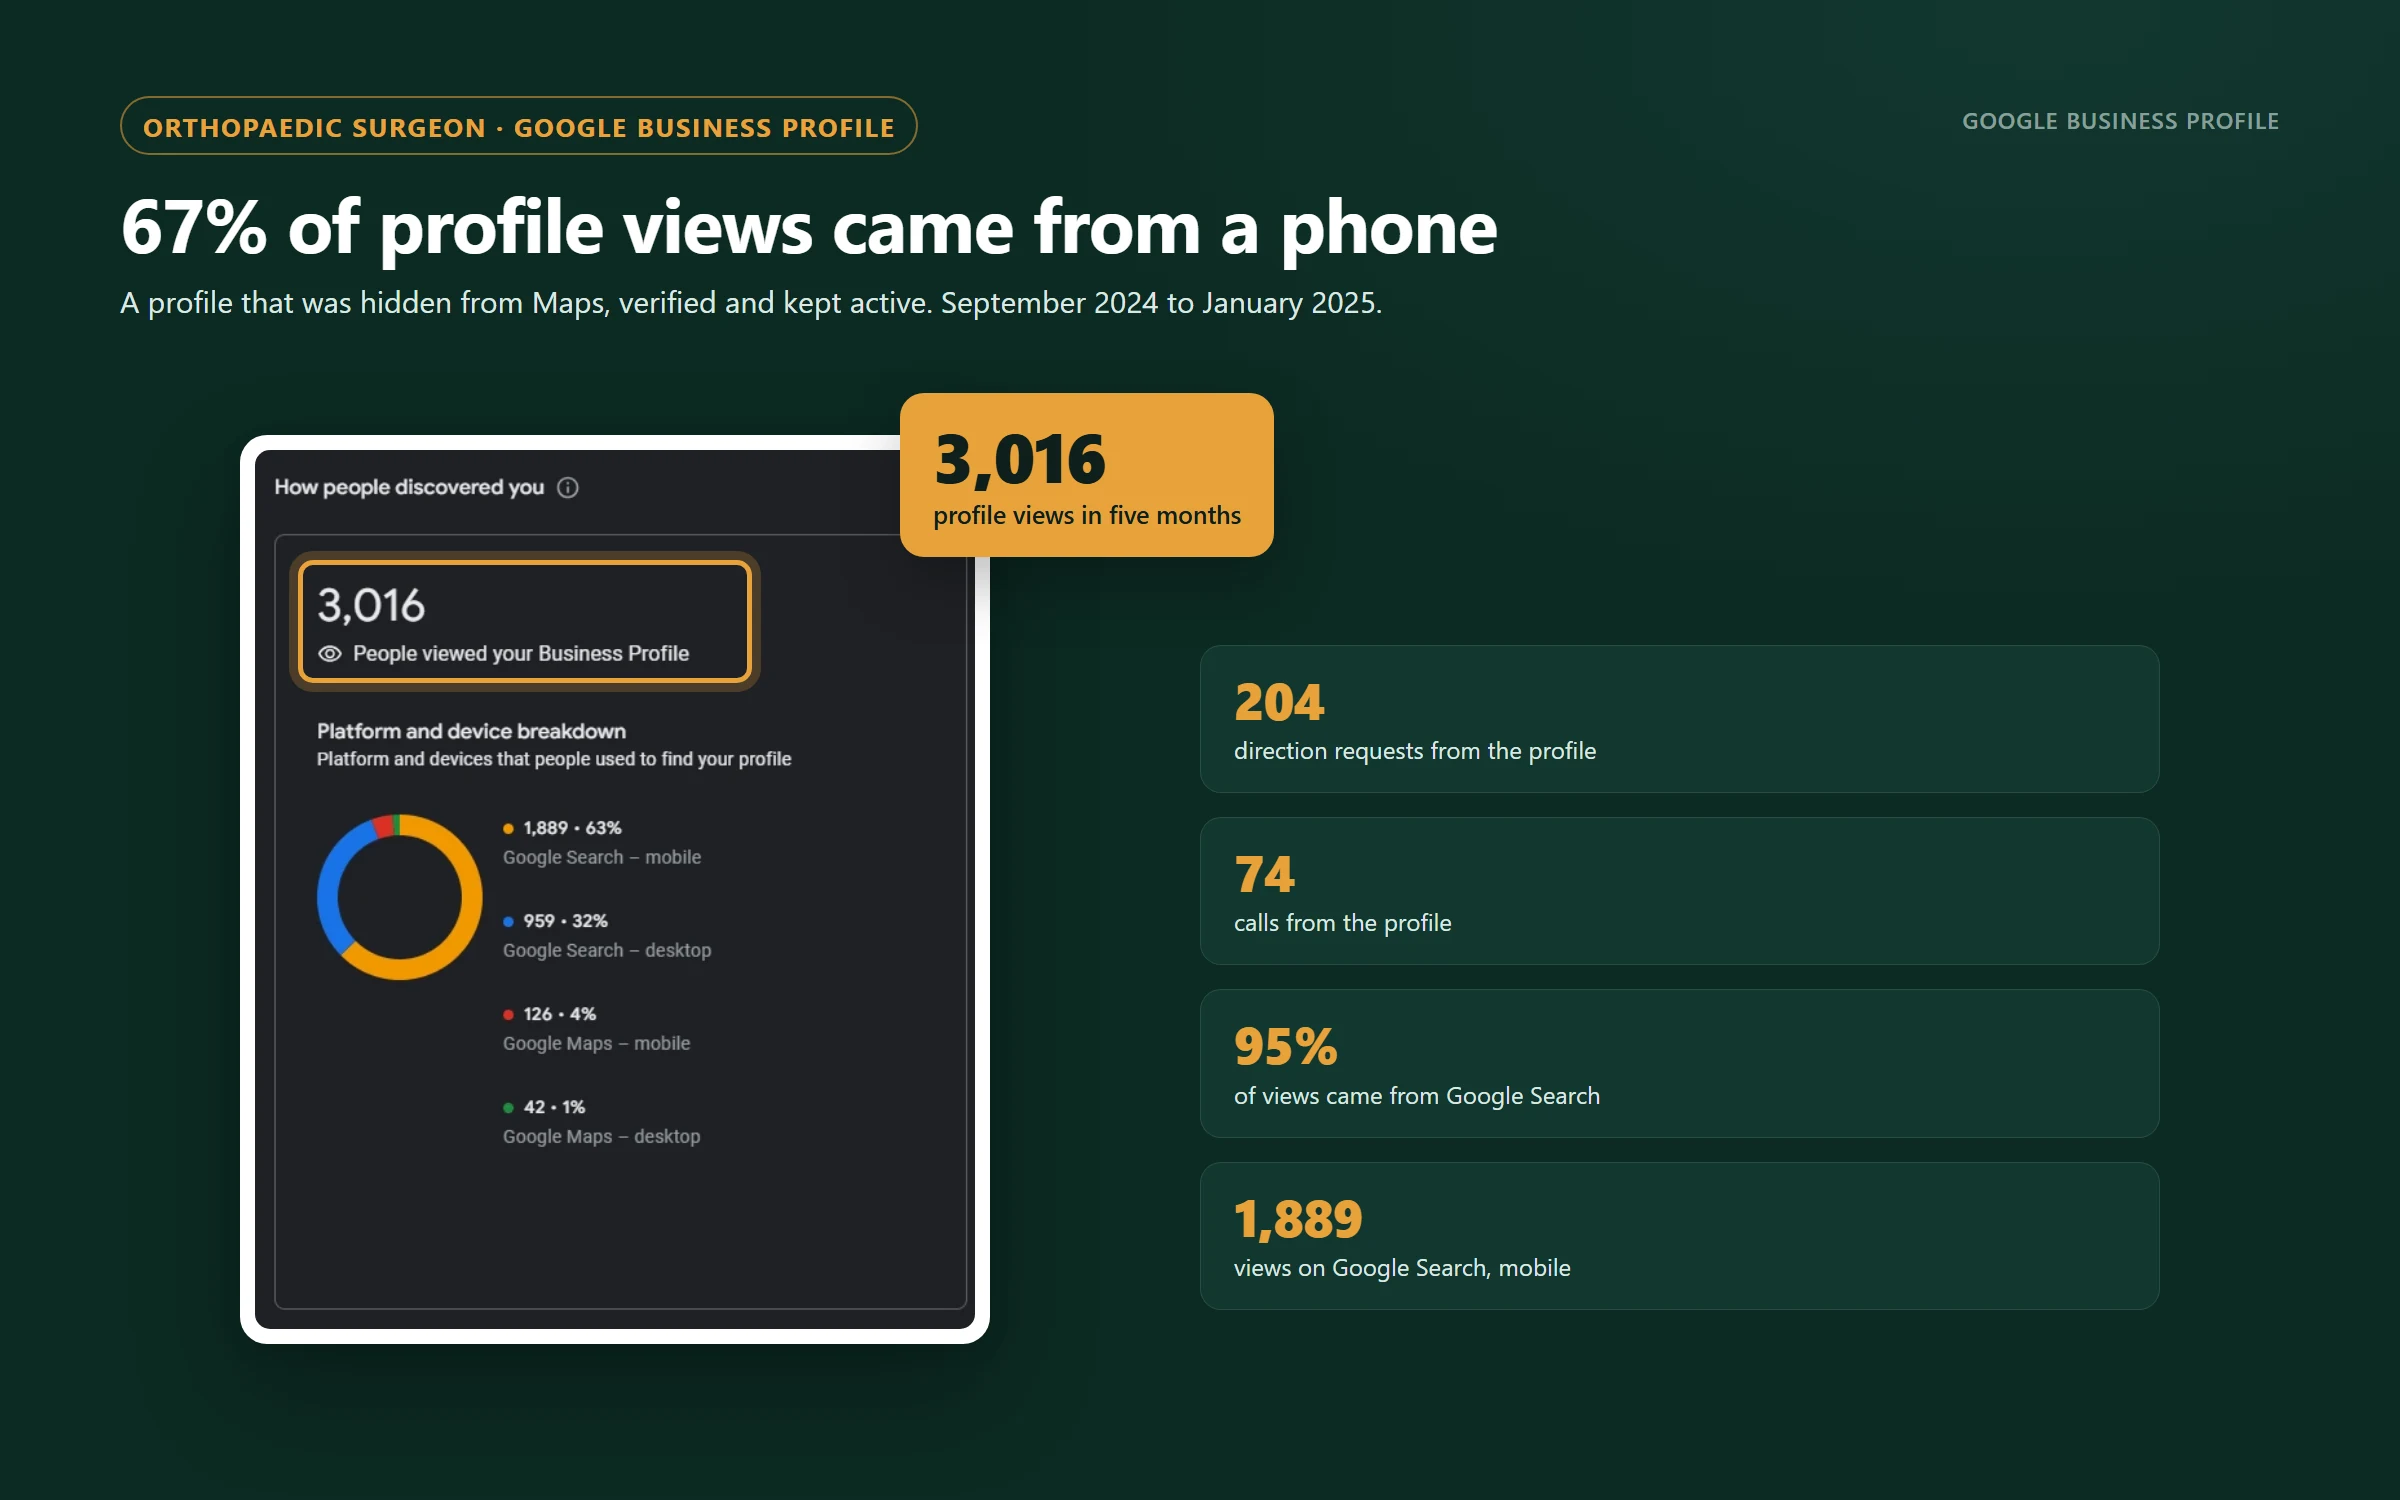
67% of 3,016 profile views came from a phone
An orthopaedic surgeon consulting inside a large Melbourne hospital had no visible Google profile. Once verified, it was viewed 3,016 times, two thirds of them on mobile.
· 3 min read
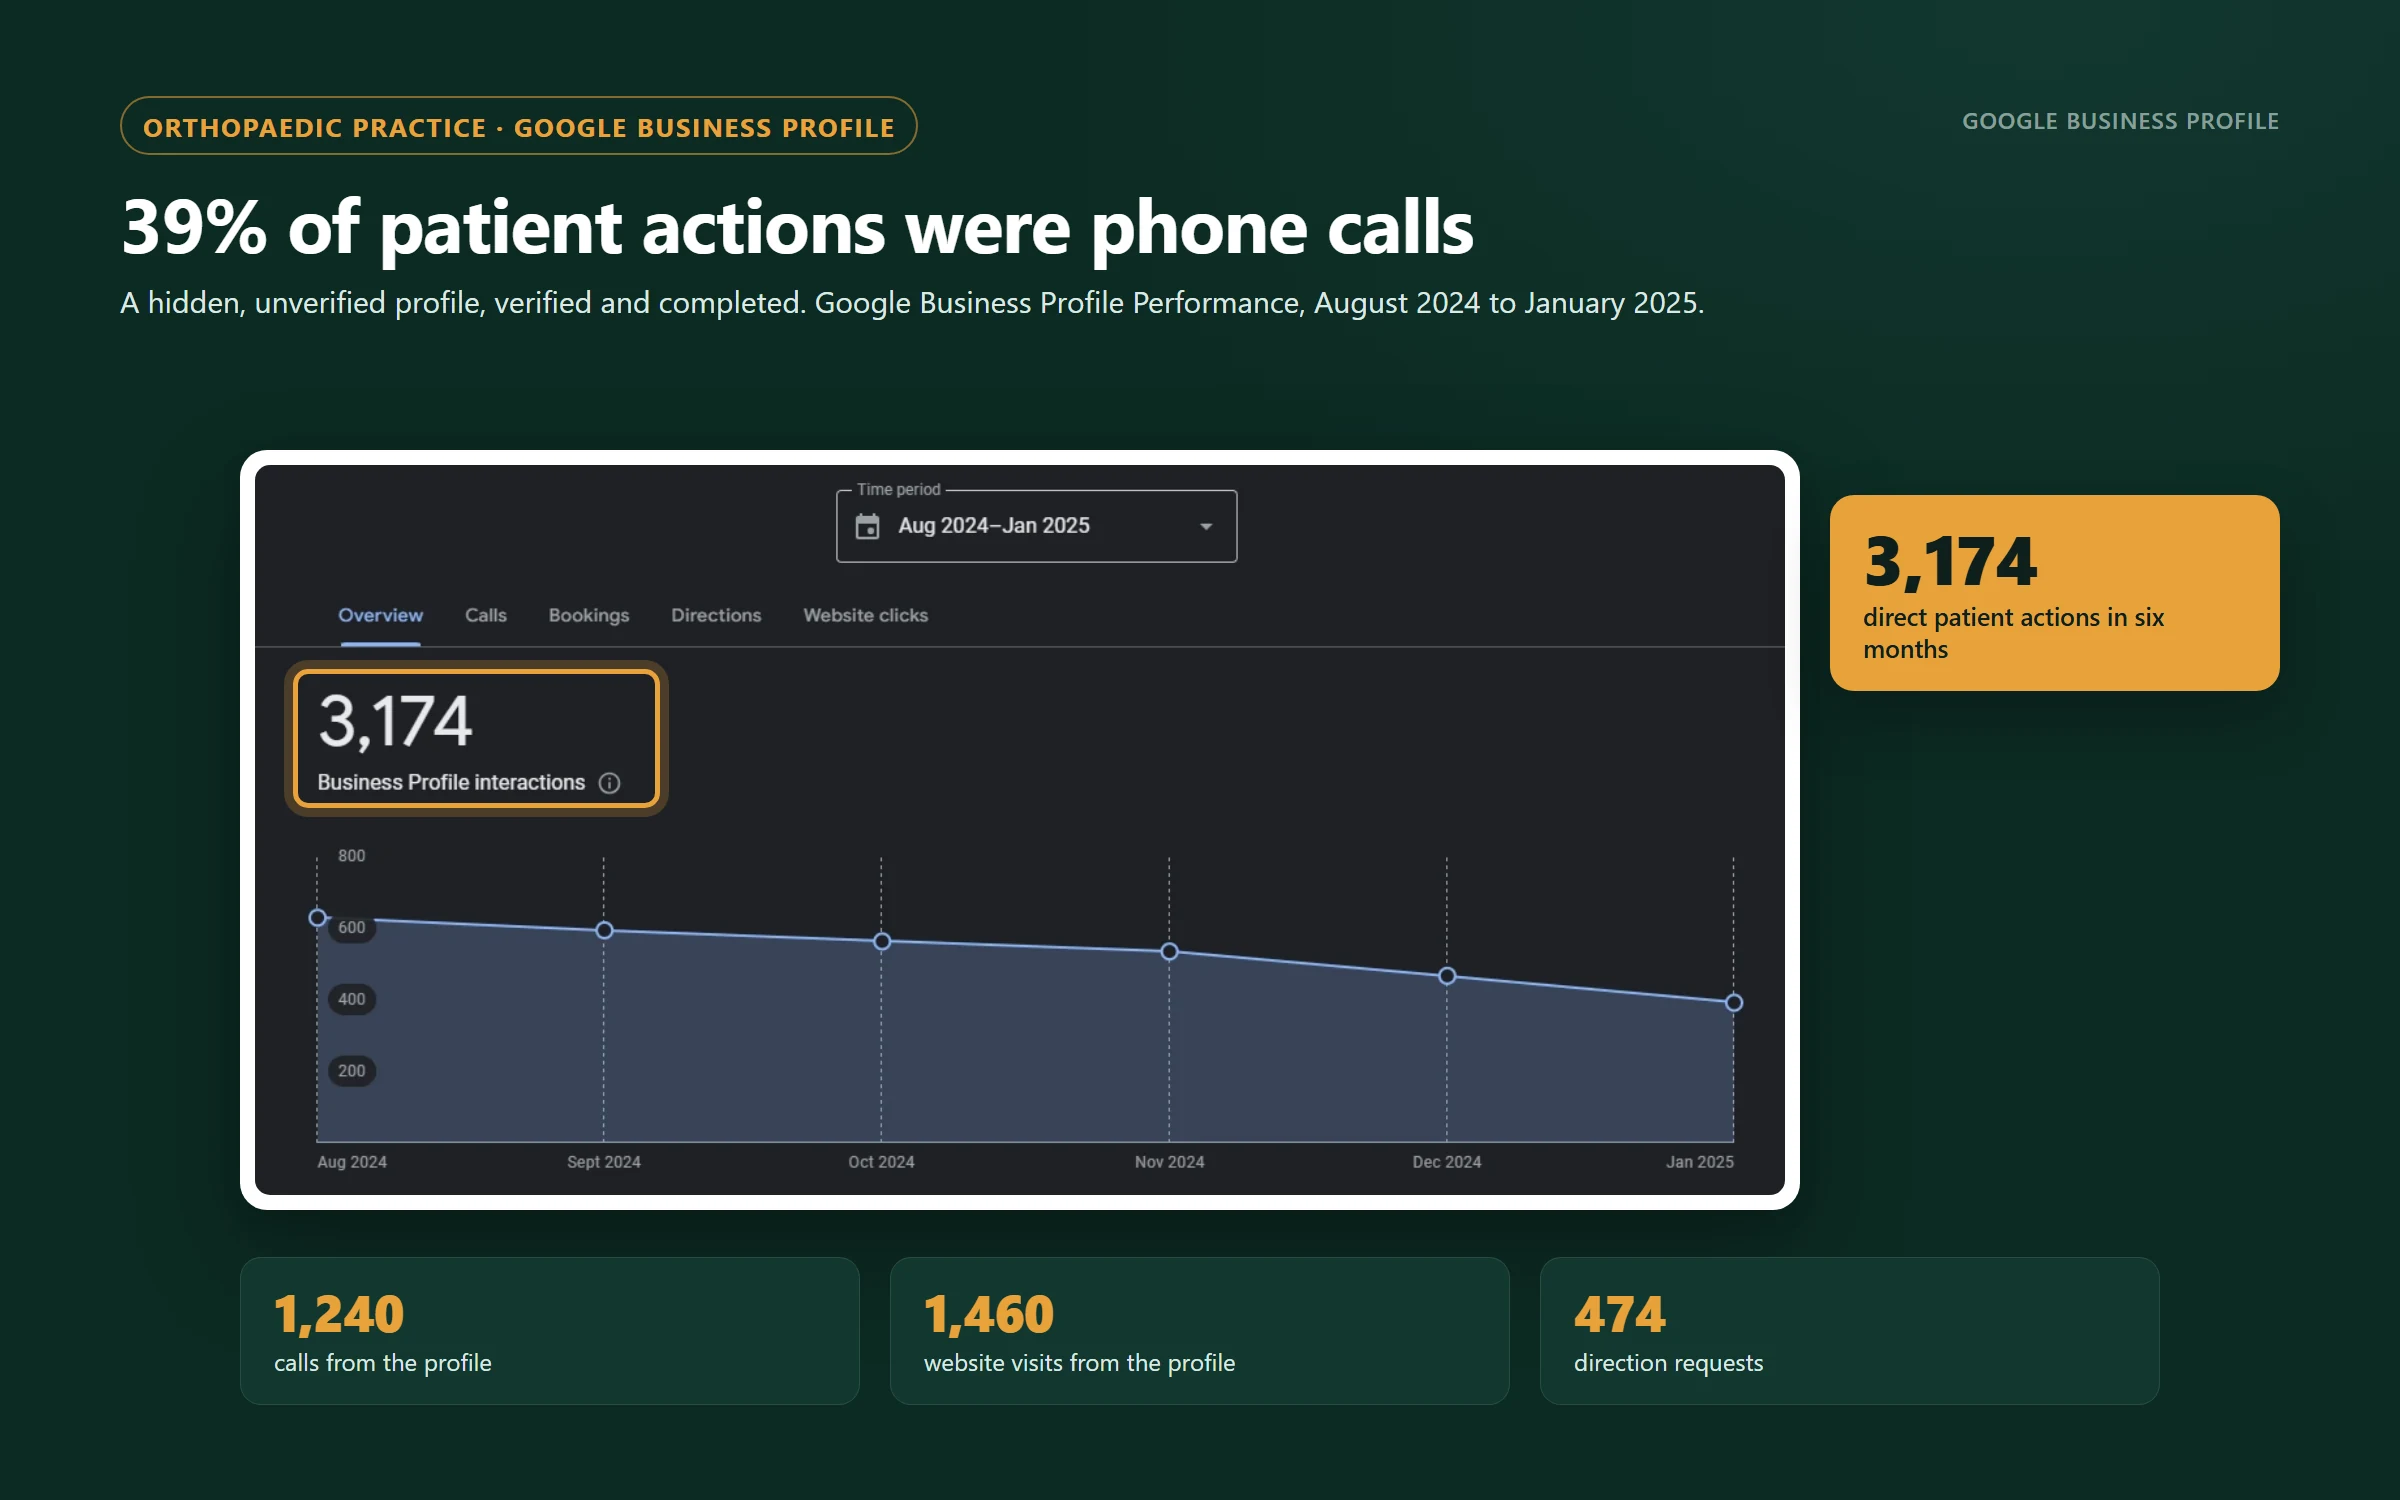
39% of patient actions were phone calls: 1,240 in six months
Patients were already searching for this Melbourne orthopaedic practice by name. A verified, complete Google Business Profile turned those searches into 3,174 direct actions in six months.
· 5 min read
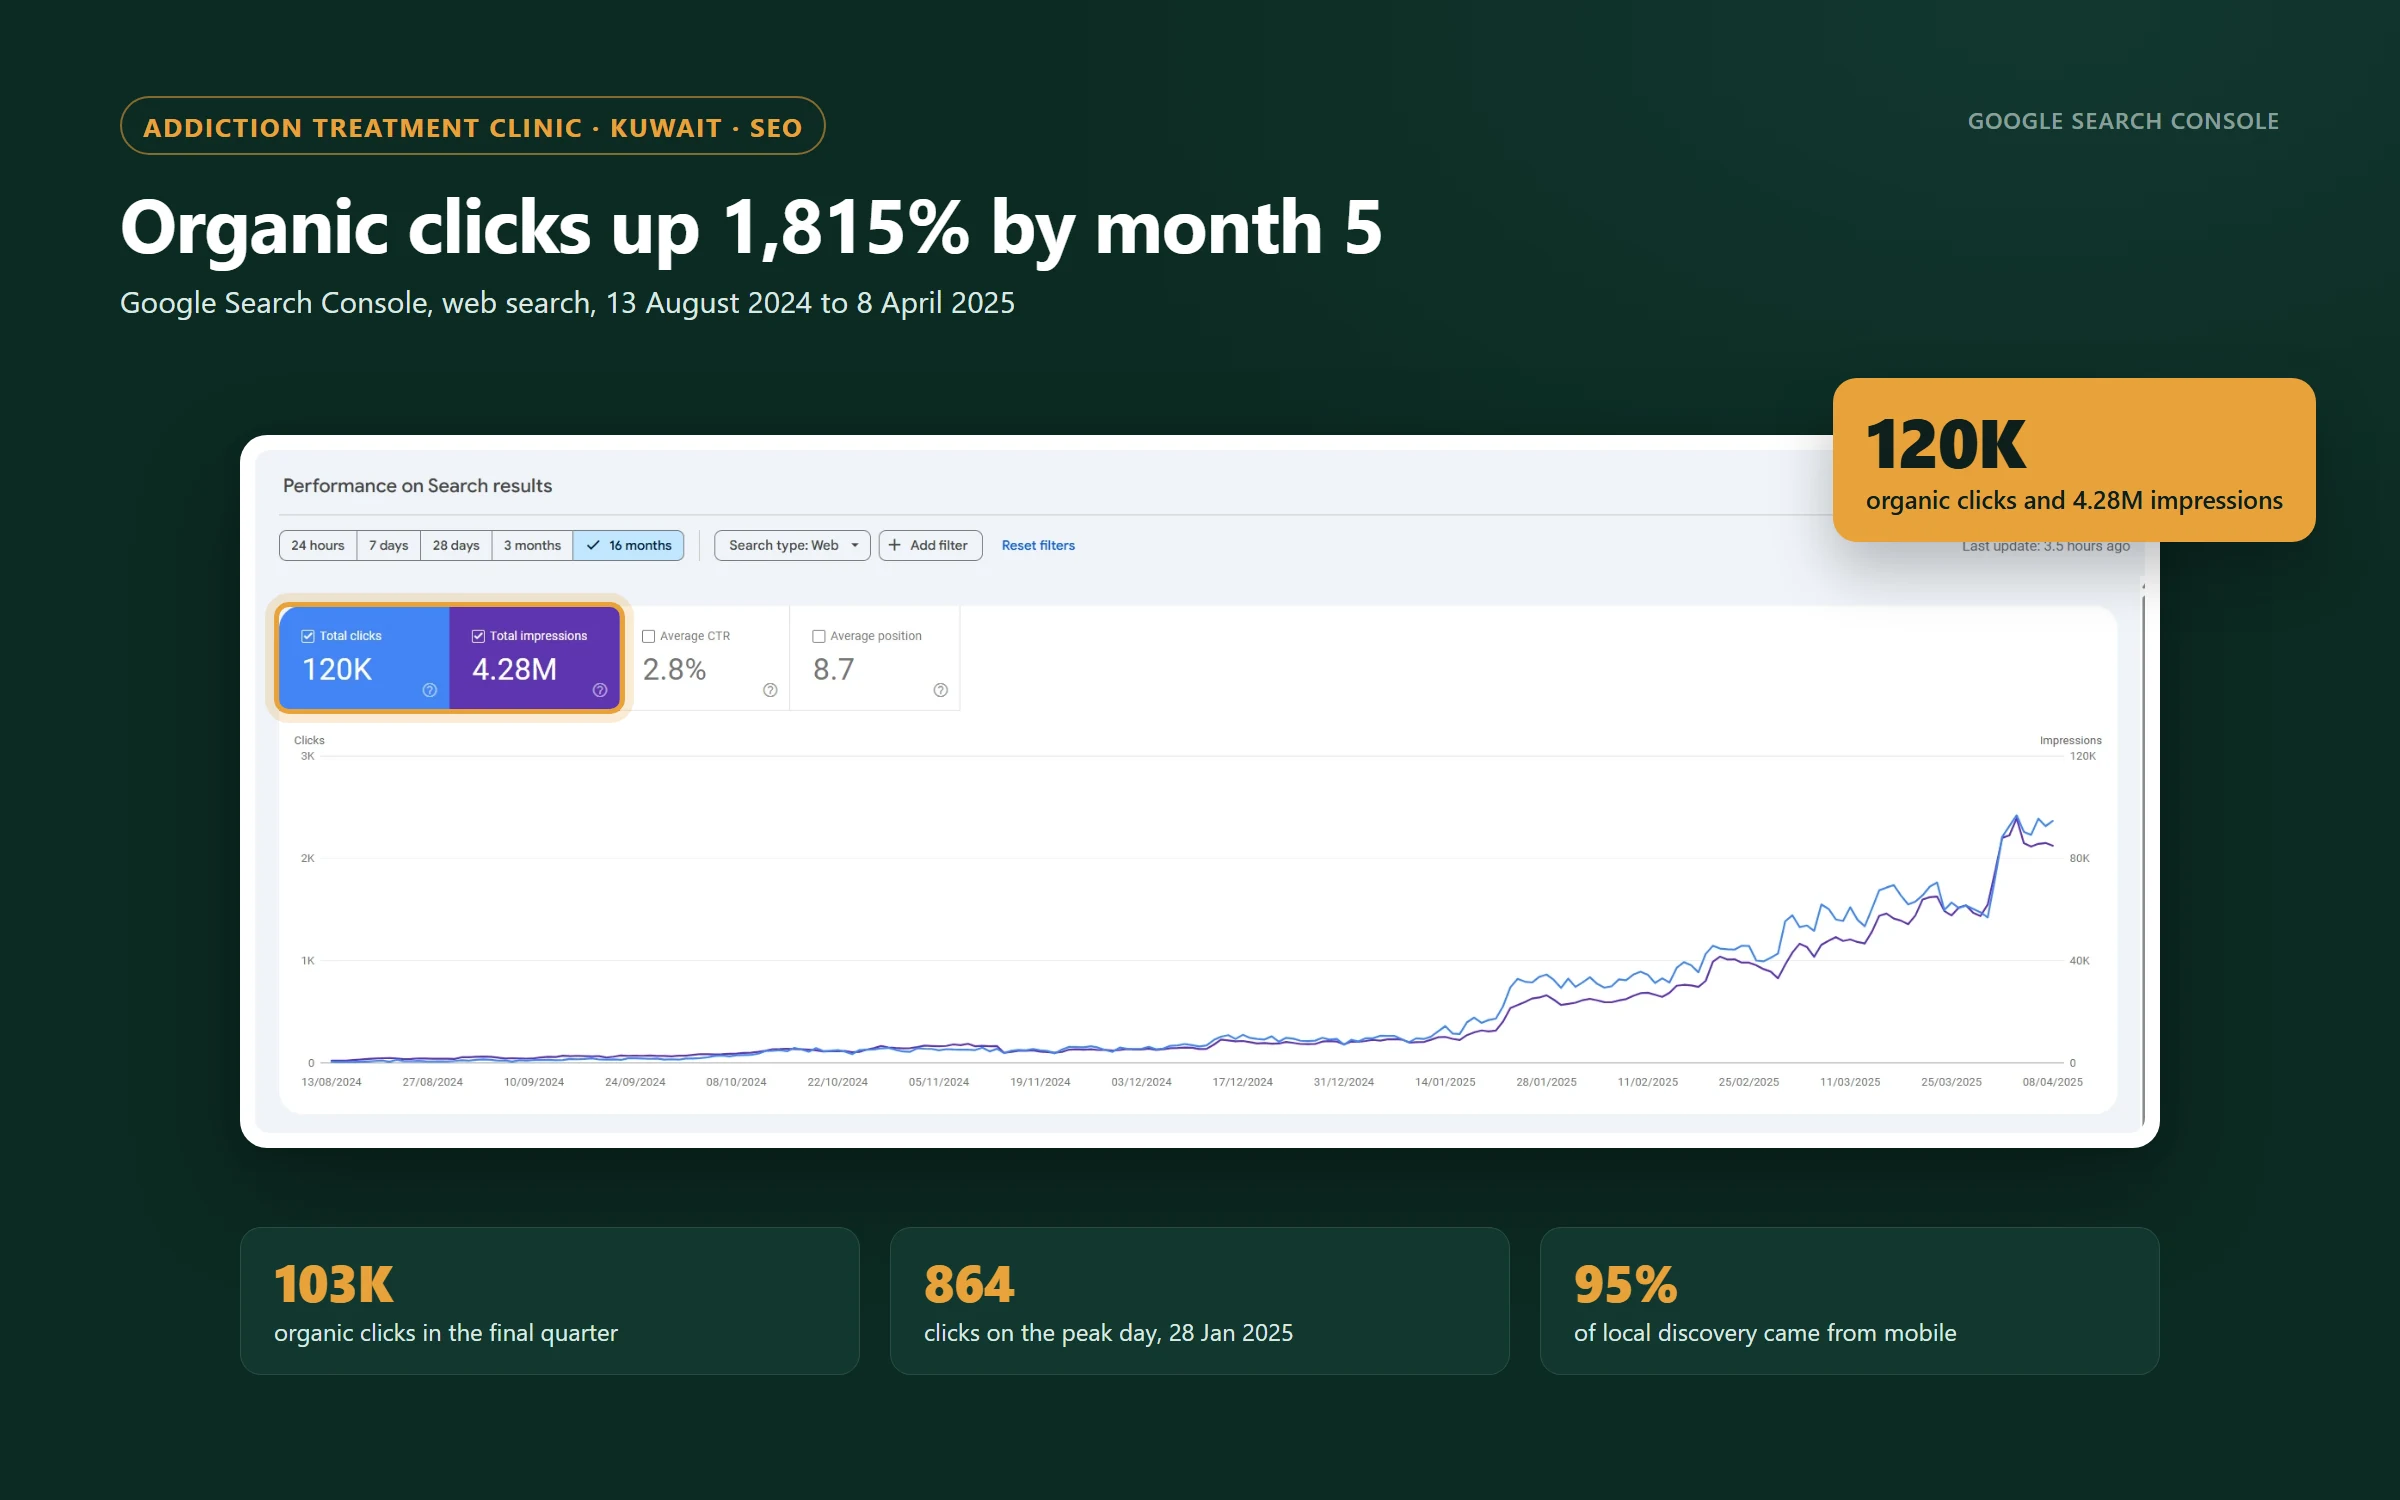
Organic clicks up 1,815% from month 1 to month 5
SEO for a restricted industry. Over eight months the clinic's site earned 120K organic clicks and 4.28M impressions, with 103K of those clicks in the final quarter.
· 3 min read
Want to know where your course platform stands?
If your platform depends on people already knowing its name, there is probably demand you are not reaching yet. Would you like us to map which of your course topics have search demand your site does not capture today?